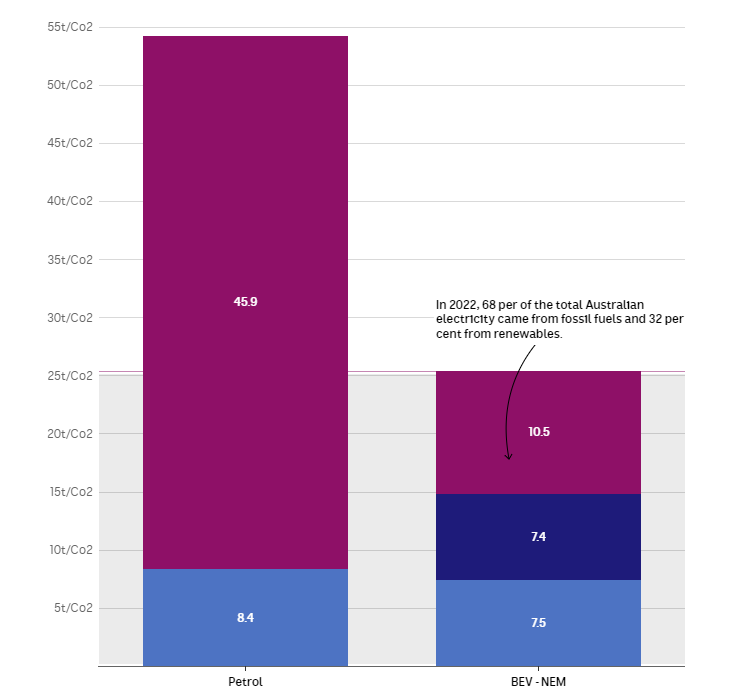
The above graph shows the key elements when comparing the emissions from a petrol vs an electric vehicle.
The light blue is the embodied carbon in the manufacture of the cars. The EV has less parts, so is slightly lower.
The darker blue represents the embodied carbon in the battery manufacture. EVs have large batteries. Petrol cars small batteries.
The maroon represents the lifetime emissions from the cars assuming a car is driven 189,000km over its lifetime. Note the EV emission are calculated at the 2022 grid emissions profile of 32% renewables. Note our grid is quickly de-carbonising as more and more renewable sources are included. The east cost grid achieved 38% of electricity from renewables in the last year. Australia’s target is to have 82% of grid power sourced from renewables by 2030. This will reduce the maroon component for EVs by more than half to improve the comparison results further for EVs.
Click here for the full source article and more graphs detailing the comparison.