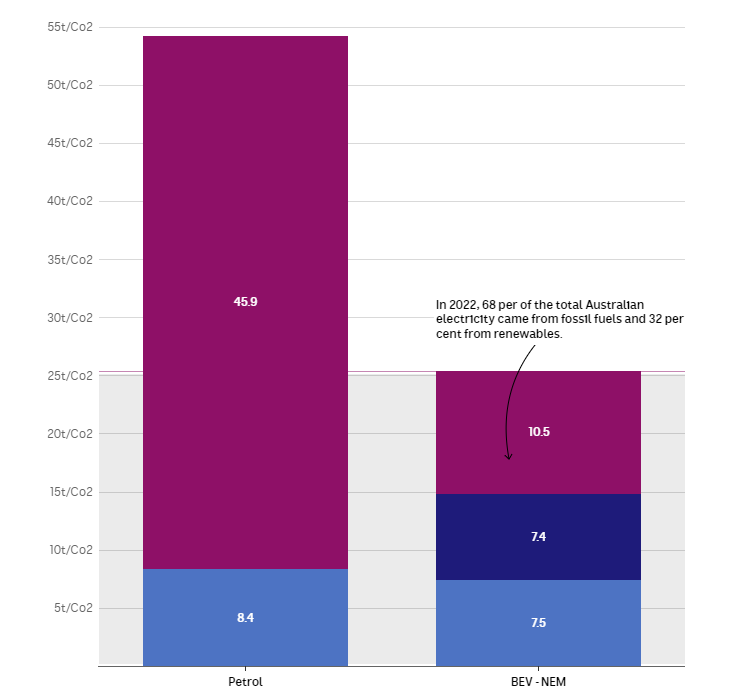
The above graph shows the key elements when comparing the emissions from a petrol vs an electric vehicle. The light blue is the embodied carbon in the manufacture of the…
The above graph shows the key elements when comparing the emissions from a petrol vs an electric vehicle. The light blue is the embodied carbon in the manufacture of the…