As a quick starting point in measuring liveability the following is one set of indices proposed in the Interface Councils Liveability Snapshot 2017 (from Table 2 – page 8).
The Interface Councils are Victorian metropolitan Melbourne growth area councils comprising: Cardinia Shire Council, City of Casey, Hume City Council, Melton City Council, Mitchell Shire Council, Mornington Peninsula Shire Council, Nillumbik Shire Council, City of Whittlesea, Wyndham City Council and Yarra Ranges Shire Council.
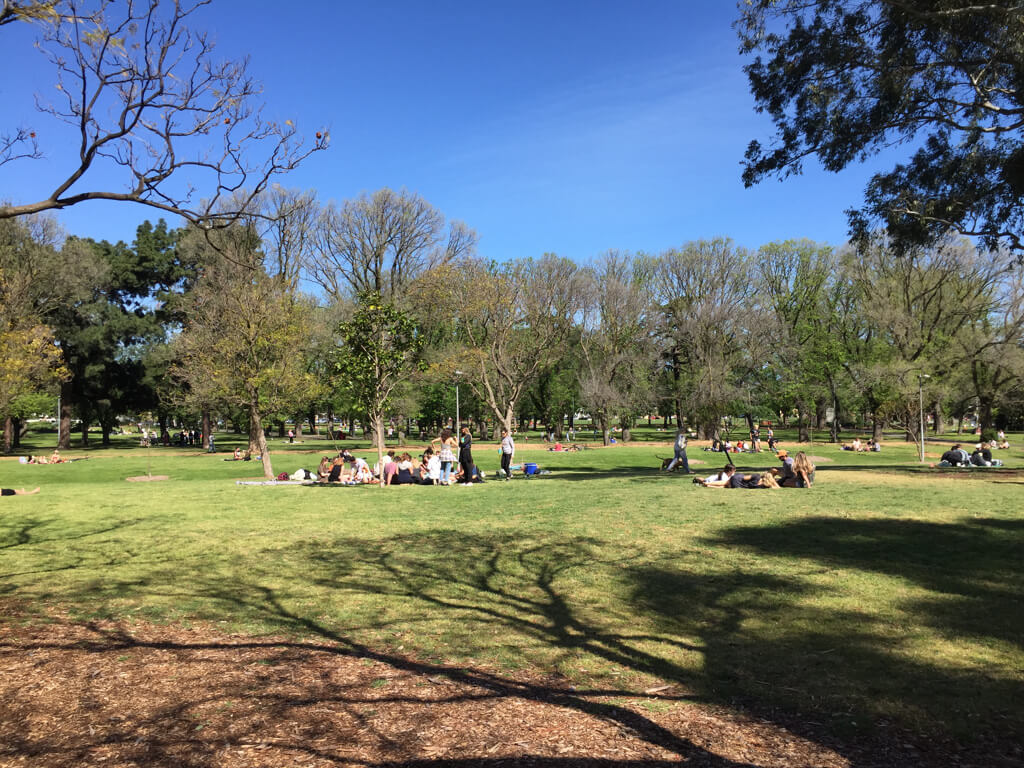
Public Open Space
• Average number of recreation sites
• Number of Australian rules ovals (other sports not considered?)
• Public open space per person (m2)
• Civic squares & promenades (ha)
• Conservation reserves (ha)
• Natural & semi-natural open space (ha)
• Parks & gardens (ha)
• Recreation corridors (ha)
• Public open space as a proportion of LGA (only indicator the Interface councils are down on)
Housing
• Aged care residential places
• Social housing as a percentage of total dwellings
• Median weekly rent for 3-bedroom home
• Households with rental stress
• Households with mortgage stress
Employment
• Unemployment rate
• Employment self-sufficiency
• Share of State labour force, local jobs and state unemployment
• People reporting adequate work-life balance
• Index of Relative Socio-Economic Disadvantage (IRSD)
Social Services & Infrastructure
• Pharmacies per 1,000 population
• Dental service sites per 1,000 population
• Allied health service sites per 1,000 population
• General practice clinics per 1,000 population
• General practitioners per 1,000 population
• People reporting high/very high psychological distress
• Family violence incidents per 1,000 population
• Percentage of Code 1 responses <= 15 minutes
• People who attend a local community event
• People who are members of a sports group
• People who could definitely access community services and resources
• Average number of pools
Transport
• Dwellings with no motor vehicle
• People with at least 2-hour daily commute
• Journeys to work by car
• Percentage of people who live near public transport
• Journeys to work by public transport
• Number of Parking Spots at Metropolitan Train Stations
• Number of Taxi Ranks at Metropolitan Train Stations
• Number of Bike Racks
• Number of Bike Lockers
• Number of Bike Cages
• Overall Transit Walk Score®
Walkability
• Overall Walk Score®
• Grocery Store Walk Score®
• School Walk Score®
• Population within 400m of public open space
• Park Walk Score®
Food Security
• People with food insecurity
• People who do not meet dietary guidelines for either fruit or vegetable consumption
The Interface Councils Liveability Snapshot was published by the Interface Councils in Sept 2017.
This blog will be added to, with more comment to come on additional valuable and alternative indices.