Recently through one of our staff members we have become aware of some fantastic websites that share a wealth of information about Australia’s energy market and climate change performance, in very simple and visual terms. Here they are to help inform better discussions about the status of our climate change performances. They show the good and the bad!
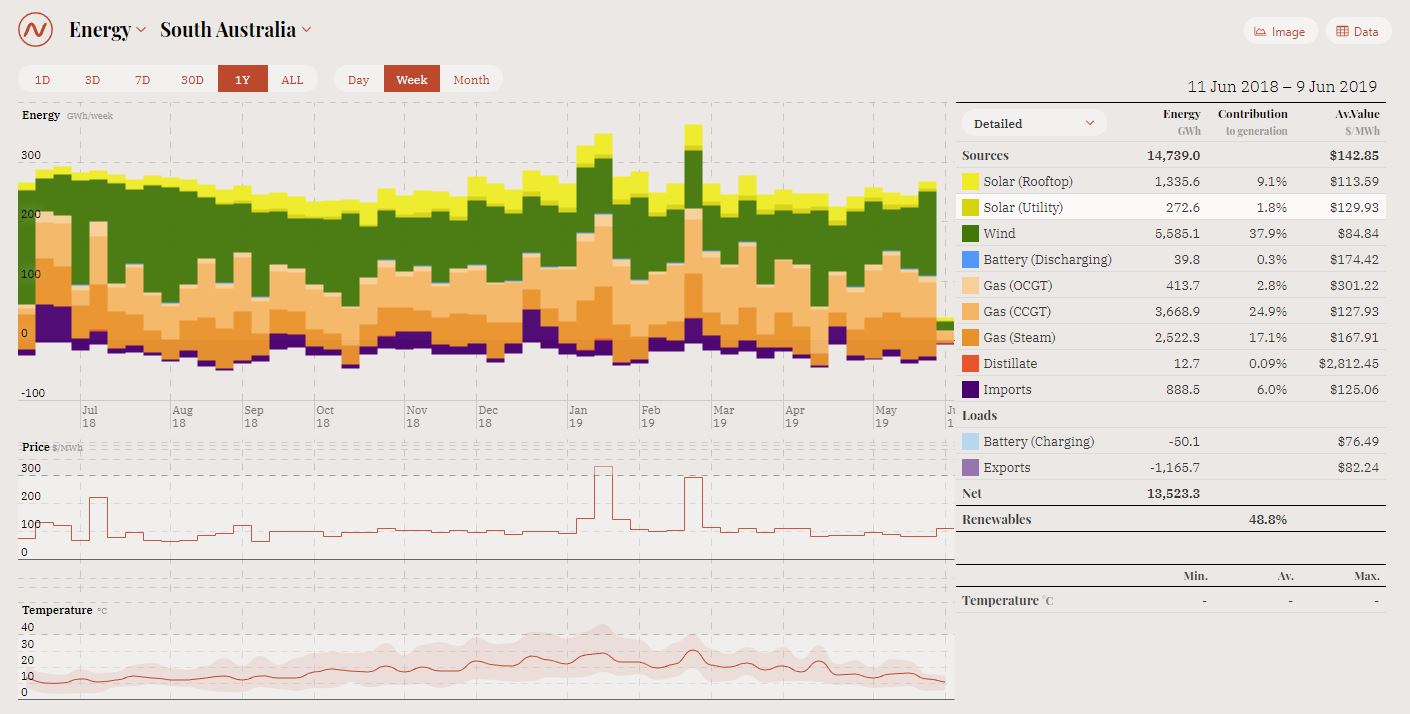
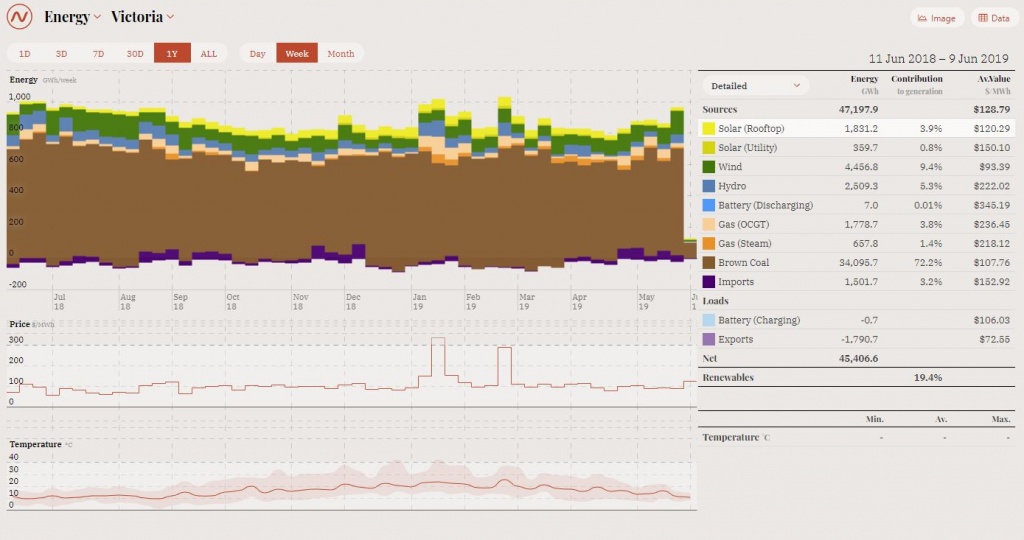
Power use by source tool – share by renewables – OpenNEM. This site uses the Open Platform for National Energy Market (eastern states energy market) data, and enables visitors to review the total power generation sourced from renewables and non-renewables for each state. Users can set historic time-frames of a day, week, month or year. In the last year with its predominant reliance on hydro plus good wind sources, Tasmania sourced 88.2% of its energy from renewables, South Australia with the successful incorporation of the Tesla battery on top of its 38% contribution from wind farms sourced 48.8% from renewables, and Victoria with a target of 40% renewables by 2025 and strong state government leadership on renewables sourced 19.4% of their power from renewables in the last year. Much like Victoria, with significant coal reserves, New South Wales achieved 12.7% renewables and Queensland achieved 9.6% renewables in the last year.
With markets supporting renewables projects, our most populous states can continue to deliver more renewables than they currently do (with some upgrades to infrastructure to be managed).
Reviewing the source of data (from the Open NEM website) “The OpenNEM project aims to make the wealth of public National Electricity Market (NEM) data more accessible to a wider audience.
“We hope that improved access will facilitate better public understanding of the market, improve energy literacy and help facilitate a more informed national discussion on Australia’s energy transition in the long term interests of consumers.
“By providing a clear window on the data, we hope to address the information asymmetry between stakeholders and improve the productivity of those engaged in energy market discussions.
“By Dylan McConnell, Simon Holmes à Court and Steven Tan”
See images above and below, and link https://opennem.org.au/#/regions
 Power transmission lines locations and key renewables areas in Australia Another key, interesting link comes from AEMO the Australian Energy Market Operator. AEMO is responsible for operating Australia’s largest gas and electricity markets and power systems, including the National Electricity Market (NEM) and the Wholesale Electricity Market (WEM) in Western Australia.
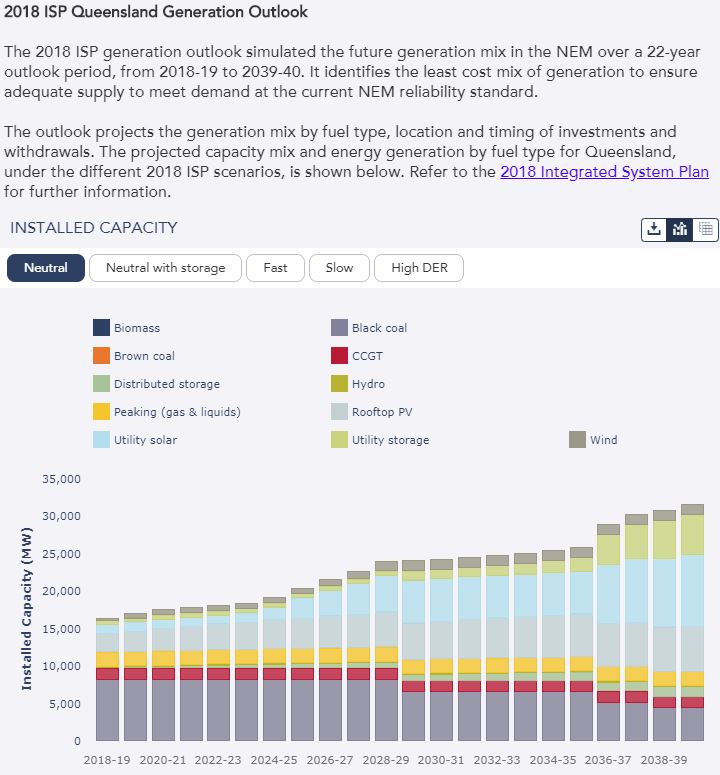
AEMO has produced an interactive map of Australia to complement their Integrated System Plan (ISP), which is a plan to help facilitate a higher level of renewables into the grid. The layers that may interest include the transmission line infrastructure, renewable energy zones and renewable resources, and also some graphs about generation forecasts for each state. See image and link below.
AEMO maps: http://www.aemo.com.au/aemo/apps/visualisations/map.html
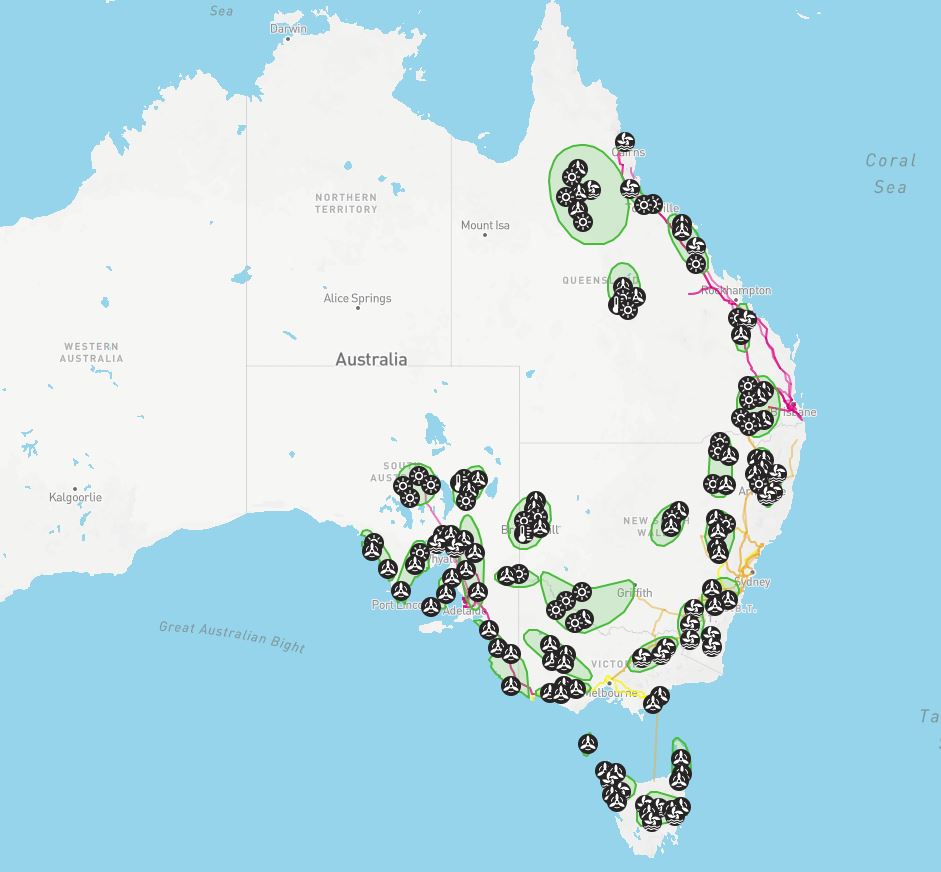 It is interesting to see how identified renewables zones appropriately are near transmission infrastructure, and surround the Gallilee Basin, where the Adani Carmichael mine is located, inland from Mackay in Queensland. A renewables zone is also located in the NSW upper Hunter Valley coal mining district. A concerted shift to renewables in these districts could help offset potential future coal mining job reductions.
It is also interesting to see the projected decreased reliance in coal across the coal reserve states based on a least cost assessment.
 National Climate Change performance
Other tools that may be of interest and mark Australia’s performance to date include:
Climate Action Tracker – tracks progress of countries to the Paris Agreement: https://climateactiontracker.org/countries/australia/
The ranking for Australia is “Insufficient”, and the Overview more damning.
The Climate Action Tracker (CAT) is an independent scientific analysis produced by three research organisations tracking climate action since 2009. (Research organisations: Climate Analytics – a non-profit climate science and policy institute based in Berlin, Germany with offices in New York, USA, Lomé, Togo and Perth, Australia, NewClimate Institute, and Ecofys – international energy and climate consultancy focused on sustainable energy, founded in 1984). The CAT tracks progress towards the globally agreed aim of holding warming well below 2°C, and pursuing efforts to limit warming to 1.5°C.
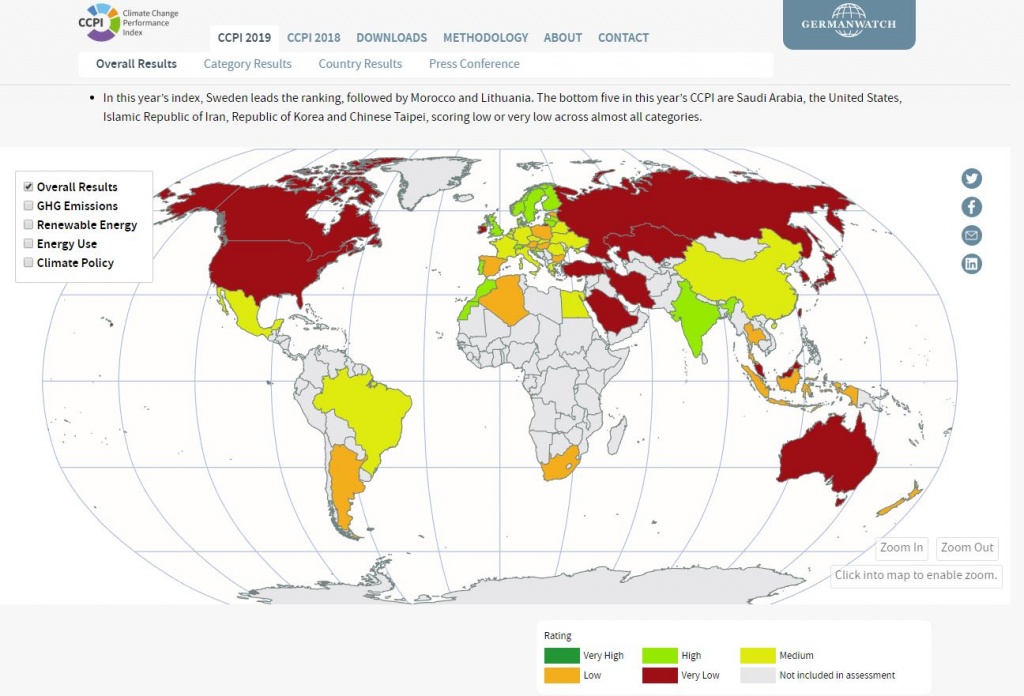
Climate Change Performance index – ranks countries in order of the level of climate protection performance (Australia is 55 out of a possible 60): https://www.climate-change-performance-index.org/
 We hope the above help in Simplifying Sustainability – which is always our goal!